This Week in Crypto, Full Written Summary: W1 March 2026
Watch on Youtube The Santiment Team reviewed the on-chain metrics following a volatile week where Bitcoin briefly reclaimed $74k before retracing yet again. Wit
আর্থিক পরামর্শ নয়। DYOR।
Read full report

Is the Bull Trap Over? Bitcoin Retraces to $68k Amid Global Tensions
Executive Summary
The Santiment Team reviewed the on-chain metrics following a volatile week where Bitcoin briefly reclaimed $74k before retracing yet again. With altcoin interest at historic lows and macro fears rising, the data gives us a clue about whether smart money is preparing for a bounce or further downside.
- Whales Take Profit at $74k: The divergence continues where large holders dumped during the recent pump, while smaller ones are aggressively buying the dip—a historically bearish signal.
- Major Geopolitical Event: Violent conflict involving the US, Israel, Iran, and several other countries in the region has triggered a new wave of market fear.
- ETF Streak Broken: After weeks of consistent inflows, the Spot ETF market recorded a significant outflow day of over $227 million, signaling institutional caution heading into the weekend.
00:00 - Bitcoin's Volatile Week & The $74k Bull Trap
It has been a topsy-turvy week for the crypto markets. Bitcoin briefly broke above 68.7k range. Despite the volatility, Bitcoin remains up 3.8% for the week. While some exchange tokens and meme coins saw gains, the market is currently deciding its next direction after what appears to have been a small bull trap.
- Key Data: Bitcoin price retraced to ~74k.
- Actionable Tip: Watch for stability around the 65k range if the retracement continues.
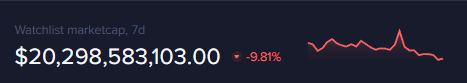
02:06 - Altcoin Season Mentions Hit Multi-Year Lows
Earlier this week, social data indicated that mentions of "Alt Season" had dropped to 3-5 year lows. Historically, when hype disappears, opportunities arise. Shortly after this data point surfaced, Dogecoin surged 15%. However, once the crowd noticed and social volume spiked, prices corrected. The sector generally ended the week down as retail traders chased pumps rather than anticipating them.
- Key Data: Altcoin sector down ~10% over the past week despite the mid-week pump(data).
- Actionable Tip: Counter-trade the crowd; look for assets with zero social hype rather than chasing those already trending.
05:52 - Whales Dumping While Retail Buys the Dip
A concerning trend has emerged regarding wallet behavior. Between February 23rd and March 3rd, whales accumulated heavily. However, the moment Bitcoin hit $74k, these key stakeholders began taking profit. Conversely, retail traders have been buying the dip over the last 48 hours. When retail buys while whales sell, it typically signals that the correction is not yet over.
- Key Data: Whales dumped approximately 66% of their recent accumulation in the last 48 hours(chart).
- Actionable Tip: Wait for the whale holdings line to flatten or rise before entering new long positions.
07:46 - How Geopolitical Conflict Impacts Crypto Markets
The escalating conflict involving the US, Iran, and Israel is the big topic at hand. Conflict and uncertainty usually results in volatility. Similar to the Russia-Ukraine conflict onset, markets are reacting fearfully. Crypto moves based on the confidence of large capital holders, not just retail panic, so it will be interesting to watch the markets over the coming weeks. The markets are also affected by the expected duration and resolvability of the conflict.
- Key Data: N/A (Macro analysis).
- Actionable Tip: Avoid trading solely on headlines; focus on whether on-chain volume supports the fear narrative.
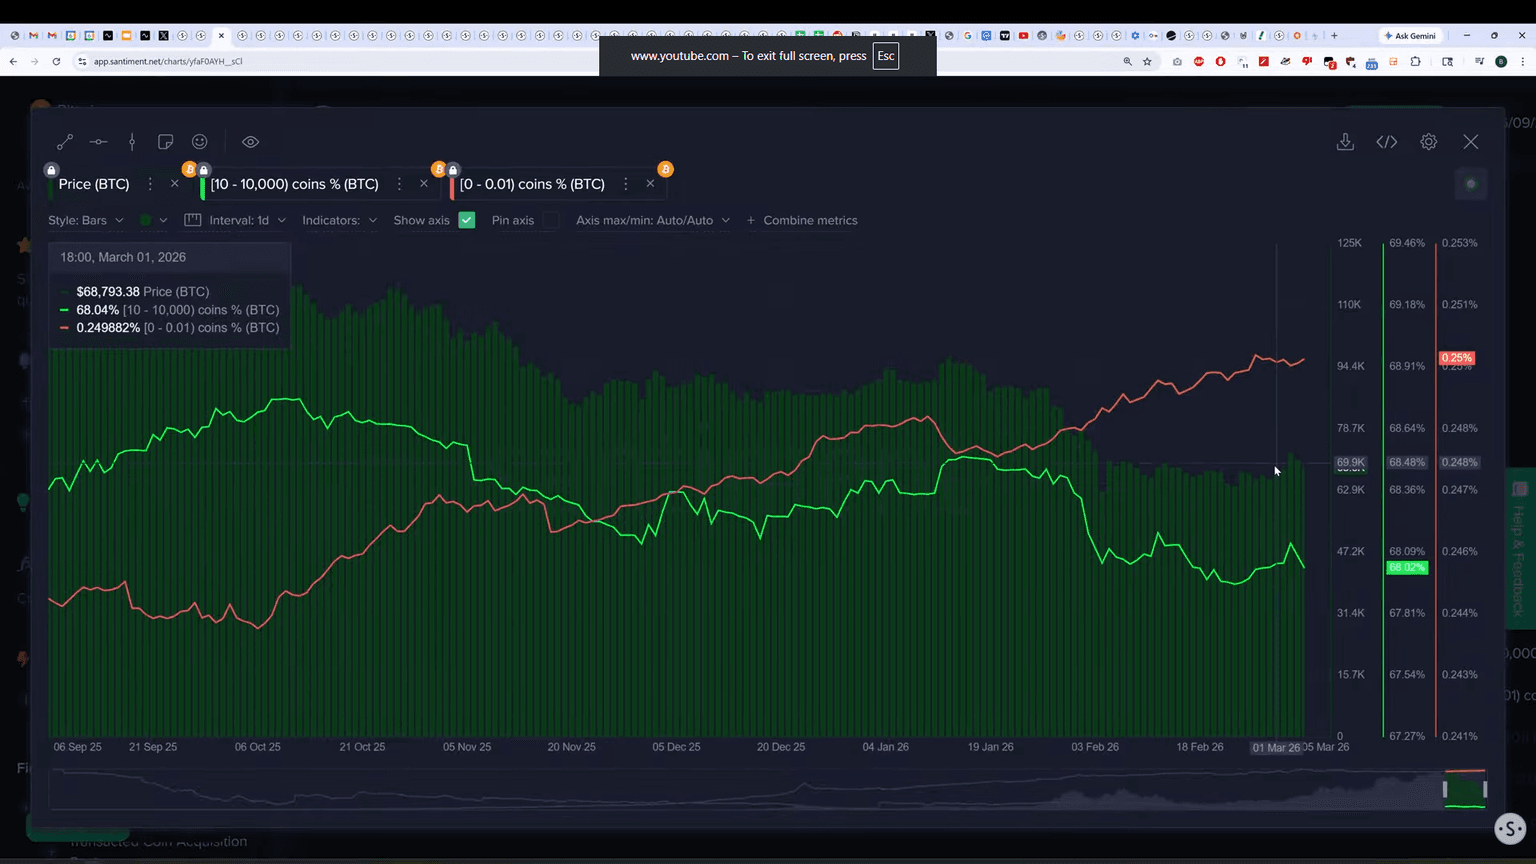
10:54 - The Most Accurate Bitcoin Price Indicator Right Now
The correlation between the 10-10k BTC wallet cohort and price action is currently extremely high. Their accumulation led to the $74k pump, and their distribution caused the current drop. The reaction time between their moves and price action is almost instantaneous right now, making this the highest-value signal for short-term direction.
- Key Data: 10-10k BTC wallets drove the 13.5% price increase and the subsequent 5.5% drop(chart).
- Actionable Tip: Monitor the 10-10k BTC wallet count daily; if they aren't buying, the rally likely won't sustain.
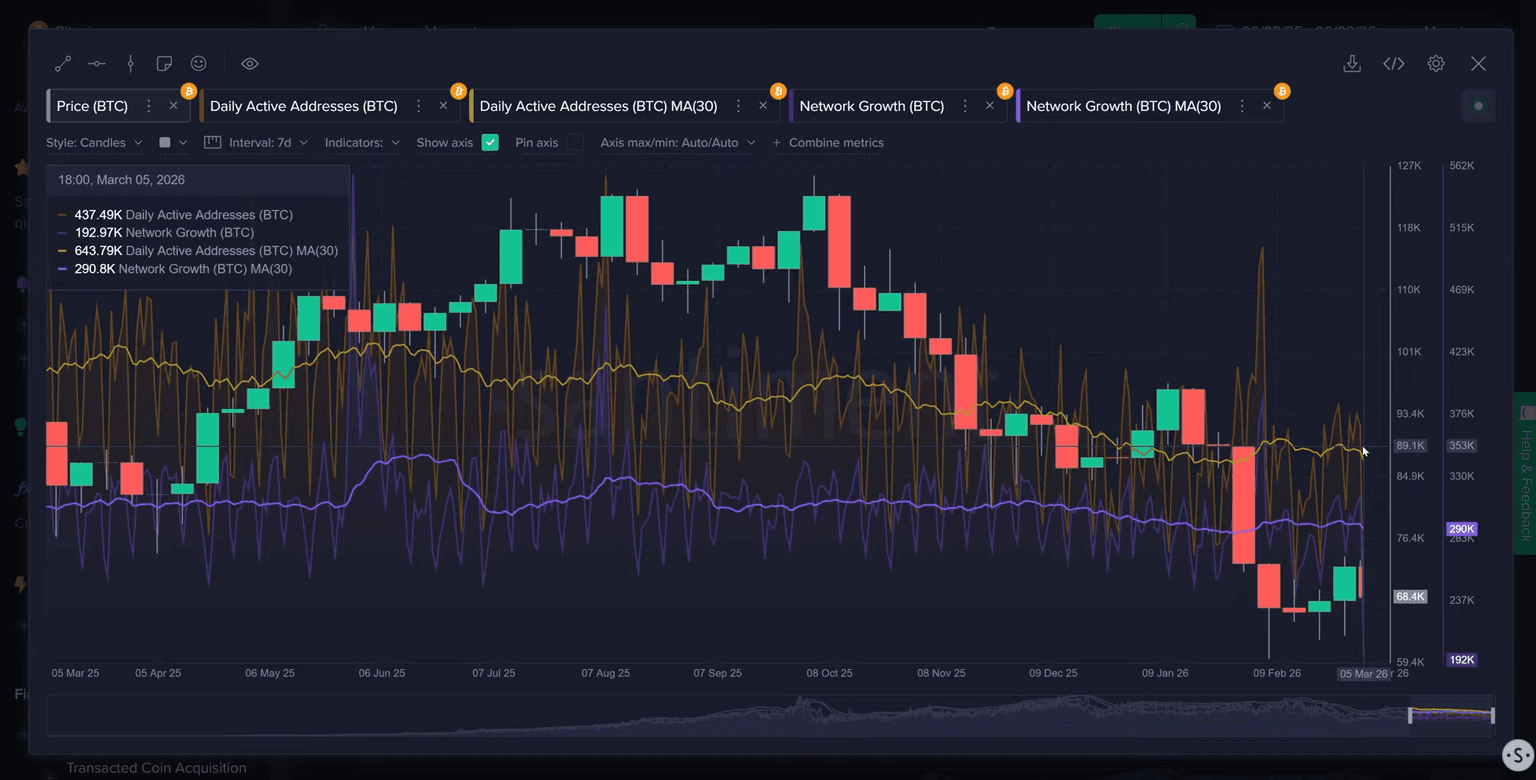
13:36 - Network Growth & Active Address Trends
Bitcoin's underlying utility metrics are showing stagnation. Transaction volume has remained average for weeks. More concerning is the decline in Daily Active Addresses and Network Growth (new wallets). Both metrics are trending downward on a 30-day rolling average, suggesting a lack of new blood entering the ecosystem despite the price volatility.
- Key Data: Daily Active Addresses at ~643k, down from ~765k peak (chart).
- Actionable Tip: Look for a divergence where price drops but active addresses rise—that is a strong bullish divergence.
14:35 - Analyzing MVRV Ratios for Long-Term Entry Points
The 30-day MVRV ratio briefly hit +5.6% during the rally, a danger zone indicating short-term traders were in profit. It has since reset to neutral. However, the 365-day MVRV remains deep in negative territory at -28.5%. This long-term undervaluation suggests that despite short-term choppy waters, the macro outlook remains favorable for patient holders.
- Key Data: 365-day MVRV at -28.5%; 30-day MVRV at ~0%(chart).
- Actionable Tip: Long-term accumulation is statistically safer when both short and long-term MVRV ratios are negative.
17:04 - Whale Transaction Spikes as Market Reversal Signals
A massive spike in transactions valued at 74k to exit positions.
- Key Data: Whale transactions spiked to 4,269 (highest in a month) right at the local top(chart).
- Actionable Tip: Treat sudden spikes in whale transaction counts as probable reversal points, not continuation signals.
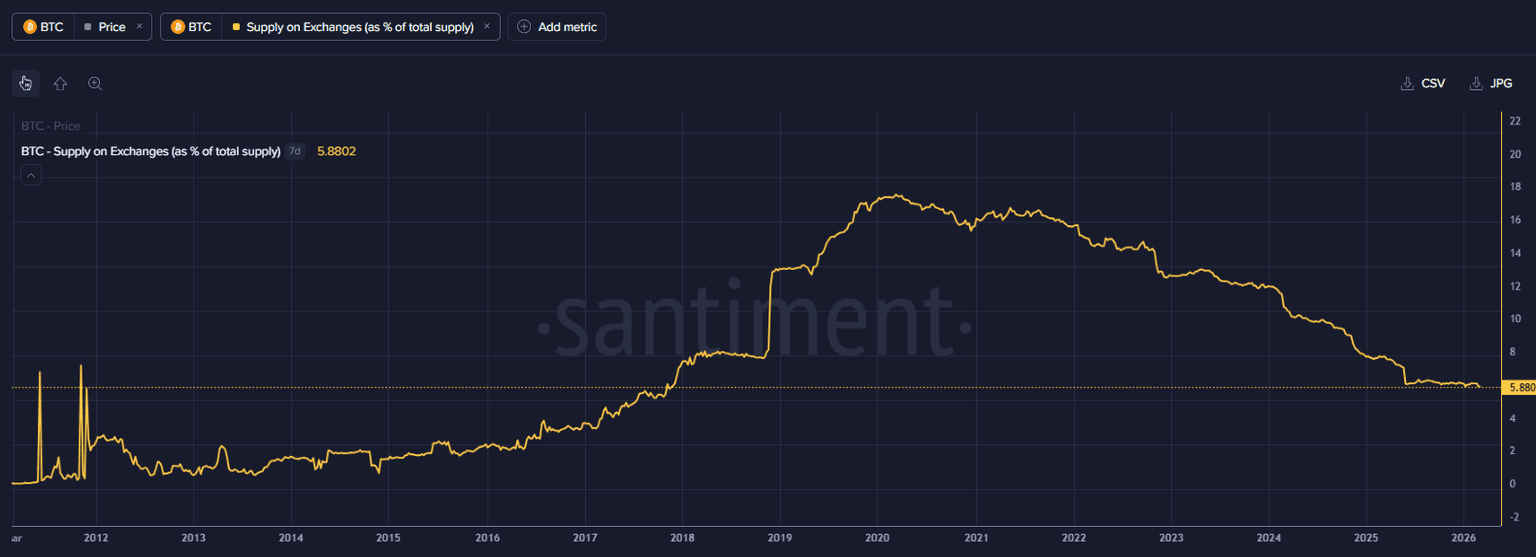
21:20 - Bitcoin Supply on Exchanges Hits 2017 Lows
In a positive long-term development, the percentage of Bitcoin supply held on exchanges has dropped to levels not seen since December 2017. Currently, only about 5.88% of the supply sits on exchanges. This indicates a continued preference for cold storage and self-custody, reducing the immediate sell pressure available on order books.
- Key Data: Supply on exchanges at 5.88%, lowest in 8 years(chart).
- Actionable Tip: Monitor this metric for sudden inflows, which would indicate whales moving funds to sell.
24:20 - Crowd Sentiment & The Dogecoin FOMO Warning
Sentiment data shows a market in conflict. Bitcoin sentiment is slightly bearish (0.95 bullish posts for every 1 bearish post), which is generally healthy. However, Dogecoin saw a massive sentiment spike (5.3 to 1 ratio) during its pump, which immediately preceded its correction. High social euphoria remains a reliable top signal for specific assets.
- Key Data: Dogecoin sentiment hit a 5.3:1 bullish ratio right before crashing(chart, just change asset to $DOGE).
- Actionable Tip: Sell into extreme social euphoria; buy when the crowd is fearful or disinterested.
29:15 - Regulatory Updates & The Clarity Act Delay
The "Clarity Act," which the White House self-imposed a deadline of March 1st to address, has been delayed, likely overshadowed by geopolitical news. The market is waiting for transparency, and the silence is adding to the uncertainty. Regulatory clarity remains a potential catalyst for future volatility.
- Key Data: Nothing happened 5 days past the self-imposed deadline for the Clarity Act.
- Actionable Tip: Watch for sudden regulatory headlines next week as the government plays catch-up.
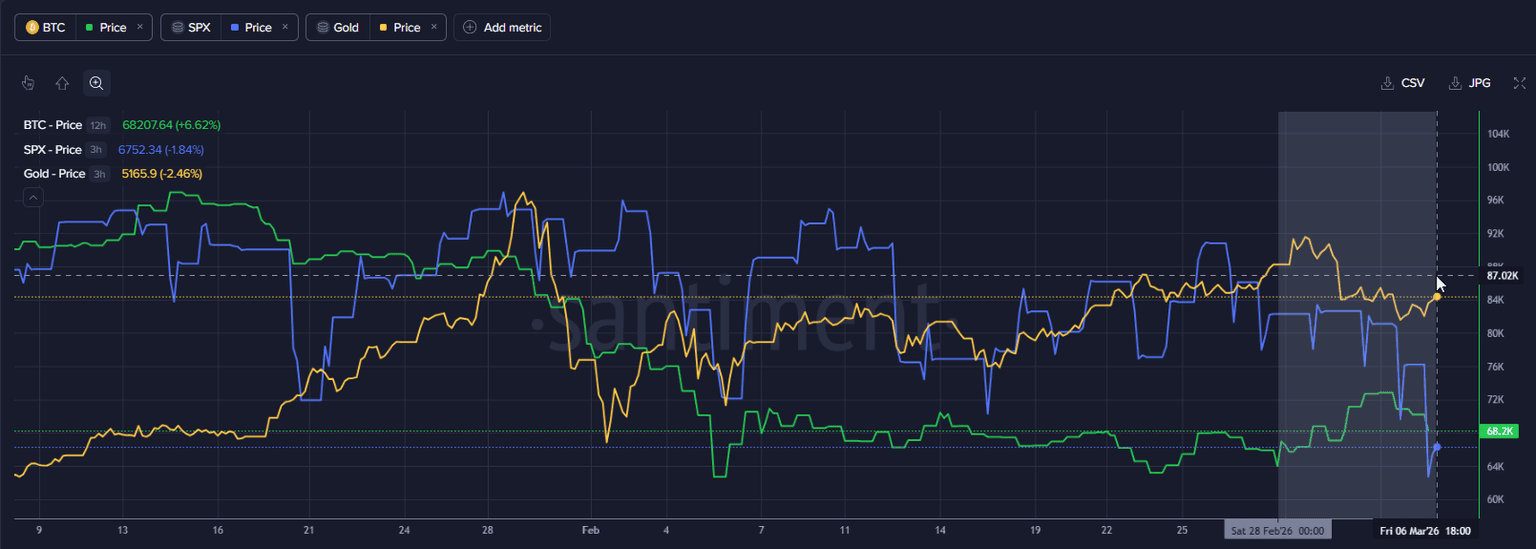
34:07 - Decoupling: Crypto vs. S &P 500 Performance
The S&P 500 has been performing poorly, dropping 2.2% over the last five weeks and hitting December lows. Interestingly, crypto has shown resilience and is not dropping as severely as the stock market. This decoupling is a potential strength, suggesting crypto is not currently trading purely as a high-beta tech stock proxy.
- Key Data: S&P 500 at lowest level since Dec 18th; Crypto outperforming relatively(chart).
- Actionable Tip: If the S&P continues to drop and Bitcoin holds $65k, the narrative of using crypto as a hedge might gain popularity.
39:31 - Spot ETF Inflow Streak Finally Breaks
After nearly three weeks of consistent inflows ranging from 500M daily, the Spot ETF market finally saw a significant outflow day yesterday. Over $227 million left the ETFs as Bitcoin broke support. This institutional caution heading into the weekend aligns with the broader risk-off sentiment.
Conclusion
The market is currently in a precarious situation. While long-term metrics like supply on exchanges and MVRV suggest the macro bull case is intact, short-term signals are not as optimistic. Whales are net selling, retail might be trying to catch a falling knife, and the geopolitical situation is reducing risk appetite. Caution is probably best until smart money accumulation resumes.
এটি আর্থিক পরামর্শ নয়। DYOR।